Synthetics Overview
1. Introduction ▾
CloudWatch Synthetics lets you create canaries: configurable scripts that run on a schedule to monitor HTTP endpoints and APIs.
Canaries can be written to follow the same routes and the same actions as a user. In this way, you can validate the user experience even when there is no user traffic.
The goal is simple: find issues before your customers do.
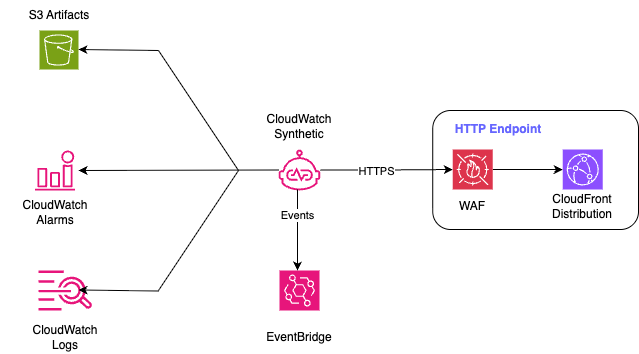
Components
- Lambda Function
- The Lambda layer includes a headless Chromium binary to take screenshots, record HAR files, and measure page timings.
- Runtime
syn-nodejs-puppeteer-18.0includes Chromium. This removes some complexity from the canary scripts.
- S3 Artifact Bucket
- Stores screenshots, HAR files and logs.
- CloudWatch
- Metrics are published to the
CloudWatchSyntheticsnamespace. - Alarms can monitor the
Duration,FailedandSuccessPercentmetrics. - Lambda execution logs are written to
/aws/lambda/cwsyn-<name>-<id>. - Synthetics integrates with Application Signals. Enable active tracing to see canaries on the Application Map.
- Metrics are published to the
2. Demonstration ▾
| Demo | Description |
|---|---|
| Multi-Check | Multi-step HTTP, DNS and TCP checks for an HTTP endpoint |
| User Journey | Leveraging CloudWatch Synthetics Recorder to create a user flow through a website |
| API | Monitoring a public stock market API and validating the response |
3. Canary Groups ▾
Canary Groups simplify the management of canaries. Canaries may be grouped based on:
- application
- endpoint
- team ownership
- runtime
- stage
Groups offer:
- Aggregating: view aggregated run results and statistics for all canaries in a group.
- Managing and automating: groups associate canaries with each other, including cross-Region canaries.
- Global resource: a group can hold canaries from multiple Regions and can be viewed from any supported Region.
- Limits: up to 10 canaries per group, up to 20 groups per account, and a canary can belong to up to 10 groups.
The Synthetics Canaries page then shows how many of your groups contain failing or alarming canaries, and the Slowest performers view can highlight the slowest group.
4. Monitoring ▾
| Mechanism | Best for |
|---|---|
| Native Monitoring tab | Investigating a single canary |
| CloudWatch Automatic Dashboards | At-a-glance health across services |
| CloudWatch Alarms | Notification when a metric crosses a threshold |
| CloudWatch Log Analytics | Reviewing Lambda execution logs |
| EventBridge | Reacting to every run result or state change |
4.1 CloudWatch Metrics
CloudWatch Metrics published by Synthetics in the CloudWatchSynthetics namespace:
| Metric | Meaning |
|---|---|
SuccessPercent | Percentage of runs that succeed and find no failures |
Duration | Duration of the canary run in milliseconds |
Failed | Number of canary runs that failed to execute (failures related to the canary itself) |
2xx, 4xx, 5xx | Network requests made by the canary, grouped by response code |
Failed requests | HTTP requests that failed with no response |
Canaries that use executeStep() or executeHttpStep() also publish SuccessPercent and Duration per step, with a StepName dimension.
4.2 CloudWatch Automatic Dashboard
CloudWatch Automatic Dashboards provide a pre-formatted Synthetics dashboard to monitor all resources in the Region.
4.3 CloudWatch Alarms
Alarms created via the Synthetics console use the naming convention Synthetics-Alarm-canaryName-index. Only alarms that follow this pattern appear in the Synthetics console (see Viewing canary statistics and details).
4.4 Log Analytics
Log Analytics can be used to deep dive into Lambda execution logs following a change in runtime or an update, for more context on the problem.
4.5 EventBridge
CloudWatch Synthetics emits an event when a canary changes state or completes a run. Consequently, an EventBridge rule can be created to notify the responsible team or initiate remediation. Rules can be configured with targets such as SNS topics, Lambda/Step Functions or Kinesis streams.
- Trigger on failed canary runs
{
  "source": ["aws.synthetics"],
  "detail-type": ["Synthetics Canary TestRun Failure"],
  "detail": {
    "canary-name": ["user_journey", "multi_step_http"]
  }
}- Trigger when a canary transitions into the
ERRORstate
{
  "source": ["aws.synthetics"],
  "detail-type": ["Synthetics Canary Status Change"],
  "detail": {
    "canary-name": ["user_journey", "multi_step_http"],
    "current-state": ["ERROR"]
  }
}- Trigger on canary lifecycle changes
{
  "source": ["aws.synthetics"],
  "detail-type": ["Synthetics Canary Status Change"],
  "detail": {
    "canary-name": ["user_journey", "multi_step_http"],
    "current-state": ["UPDATING"]
  }
}
5. Common Issues ▾
| Type | Symptom | Likely cause | What to check |
|---|---|---|---|
| Timeout | "No datapoint" or timeout error | Run exceeded the timeout | The default timeout equals the frequency. Adjust it (no higher than the frequency) and keep it at least 15 seconds. Artifacts are not shown in the console in this case, so read the CloudWatch Logs log group. |
| Timeout | "Target closed" protocol error | Asynchronous work after the browser closed | Make sure every asynchronous operation is awaited before the script ends. |
| S3 Artifact Failure | Unable to upload artifacts to S3 (Access Denied) | IAM role, bucket or KMS permissions | Role has s3:ListAllMyBuckets, s3:GetBucketLocation and s3:PutObject (plus s3:GetObject for visual monitoring). Same permissions in any VPC S3 endpoint policy. KMS key and bucket policy encryption settings. |
| Canary Script | Element not found, or click fails | Wrong selector or element off screen | Check the screenshot, verify the XPath, and adjust the viewport (default is 1920 x 1080). |
| Runtime | Failure after a Lambda runtime update | Rare incompatibility with a Lambda runtime patch | Move to a newer Synthetics runtime. In supported Regions, Lambda runtime management manual mode can temporarily roll back. |
| Runtime | Failures after a Synthetics runtime change | Library function not in the older runtime, or a CORS difference | Check function availability for the runtime and the CORS guidance in the troubleshooting guide. |
| Network | "No test result returned" on a VPC | No path to CloudWatch and S3, or public subnets | Add VPC endpoints if there is no internet access and enable DNS resolution and DNS hostnames. Use private subnets. See Running a canary on a VPC. |
| Network | Canary reaches an internal endpoint | Endpoint is not publicly reachable | Run the canary on a VPC. |
| Network | New VPC canary goes to ERROR or cannot be updated | Role lacks network interface permissions | ec2:CreateNetworkInterface, ec2:DescribeNetworkInterfaces and ec2:DeleteNetworkInterface (included in AWSLambdaVPCAccessExecutionRole). |
| Network | Requests blocked by AWS WAF | Canary traffic is filtered | Allow a custom user-agent string that you set in the canary. |
6. Pricing ▾
CloudWatch pricing for this feature is based on each canary run.
| Synthetics canary run event | $0.0012 per canary run |
However, additional charges may apply for related AWS Services (e.g. Lambda, S3, CloudWatch Logs and Metrics). See Example 16 on the CloudWatch pricing page for a worked example on all charges related to operating Synthetics over a 1 month billing cycle.
Cost Optimization
| AWS Service | Optimization |
|---|---|
| Lambda | Increase canary execution interval |
| Lambda | Right-size |
| CloudWatch | Limiting the number of steps to reduce metrics |
| CloudWatch | Set log group retention on Lambda execution logs |
| S3 | Disabling screenshots when not necessary |
| S3 | Set S3 Lifecycle policy |
7. Best Practices ▾
| Recommendation | Description |
|---|---|
| Incorporate AWS Secrets Manager | Store secrets externally, with support for automatic rotation |
| Graceful Degradation | Continue canary run despite individual steps failing |
| Right-Size Function | Configure appropriate memory |
| Right-Size Intervals | Critical: 1 minute / Standard: 5 minutes / Low priority: 15 minutes |