How can I get more information on Cross-AZ Traffic?
Customers often encounter unexpected charges due cross-AZ data transfers. How to do identify the resources and the applications incurring these charges?
Short Description ▾
Network Flow Monitor is a CloudWatch feature that exposes performance and availability metrics for EC2 and EKS workloads. In this article, we'll discuss using Network Flow Monitor with custom VPC Flow Logs to identify the top contributors to cross-AZ traffic and details on the resources and applications involved.
Here is a summary of the steps:
- Install the Network Flow Monitor in an EC2 Autoscaling Group
- Create a Network Flow Monitor to collect the corresponding information
- Query Network Flow Monitor for the top contributors to InterAZ traffic
- Analyze the corresponding custom VPC Flow Logs to provide more context on the transfers between endpoints
1. Using Network Flow Monitor to isolate Inter-AZ Traffic ▾
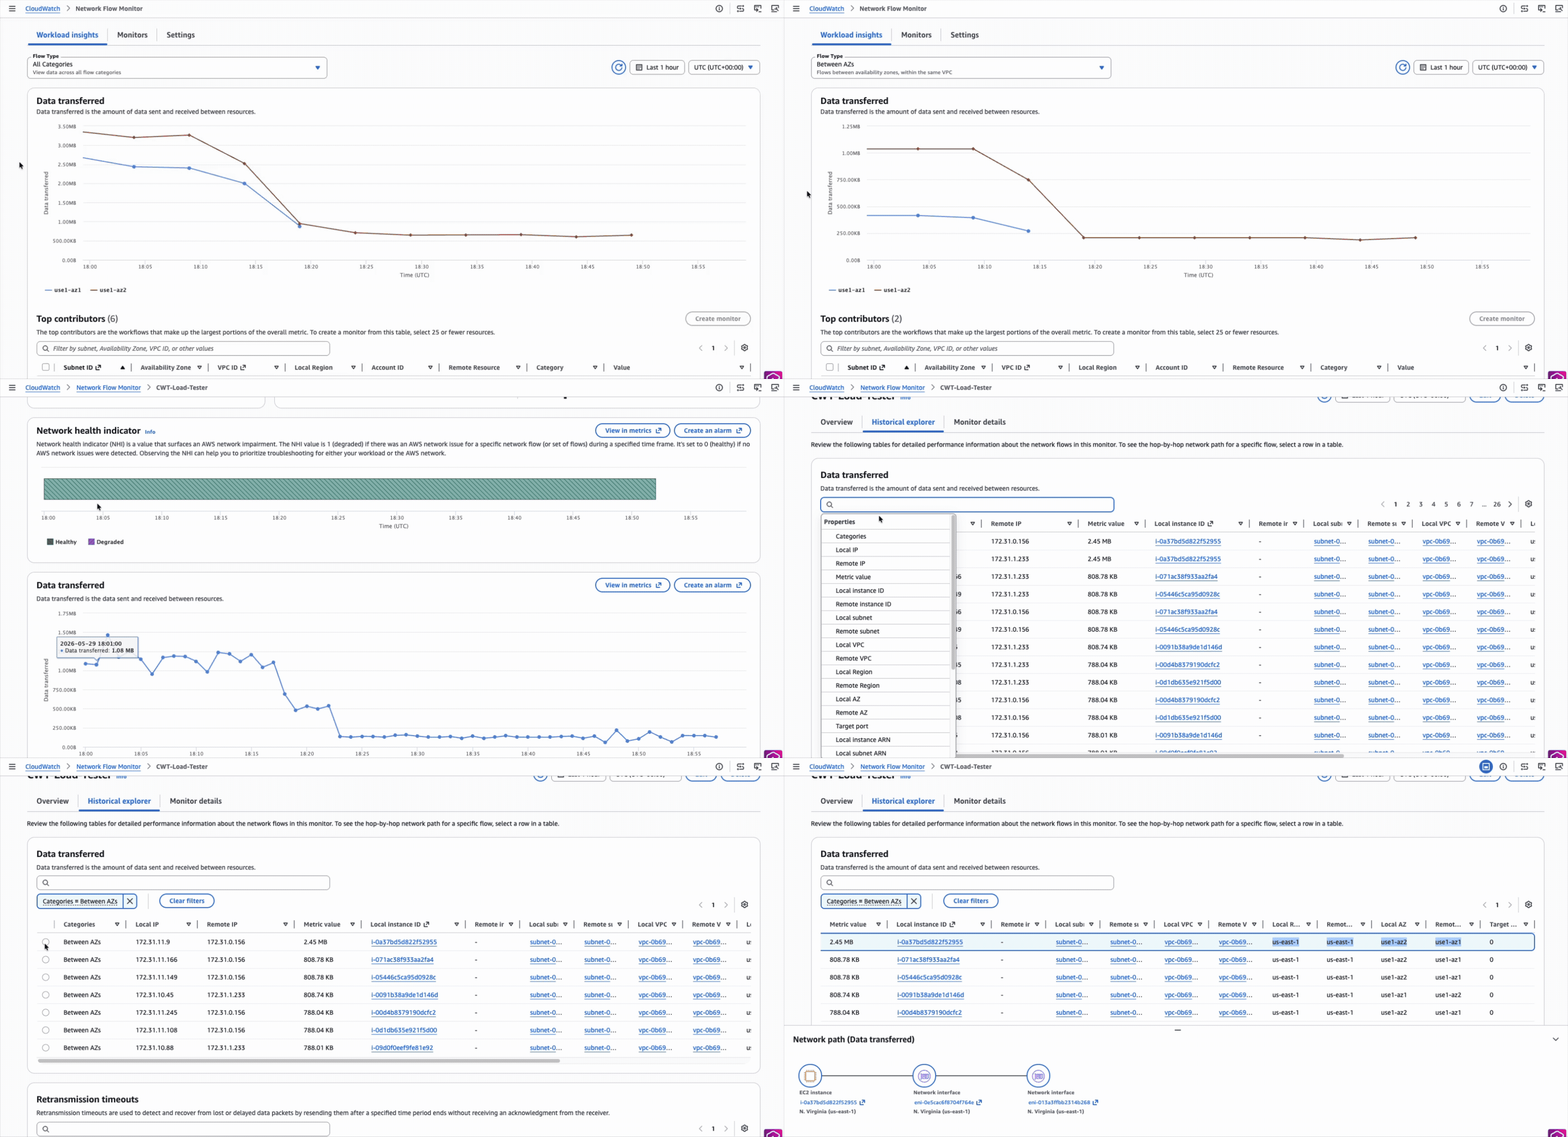
Network Flow Monitor offers the ability to directly filter traffic flows between Availability Zones (AZ's). For a given time range, details on data transfers include IP addresses, ports, subnets, VPC's and pathing information. This CloudWatch feature supports both EC2 and EKS workloads.
1.1 Install Network Flow Monitor Agent
In this use case, the CloudWatch Network Flow Monitor Agent was installed via the userdata in an EC2 Launch Template. This would enable all instances in the Autoscaling group to then publish performance metrics to the Network Flow Monitor service. For reference, here is sample userdata:
printf "\n##Download & Install CloudWatch Network Flow Monitor Agent\n"
wget https://networkflowmonitoragent.awsstatic.com/latest/x86_64/network-flow-monitor-agent.rpm

printf "\n##Install CloudWatch Network Flow Monitor Agent\n"
rpm -Uvh network-flow-monitor-agent.rpm

printf "\n##Confirm CloudWatch Network Flow Monitor Agent is running\n"
service network-flow-monitor status
1.2 Create a Scope
A scope is required before creating a monitor. This is a one-time setup per account/region.
aws networkflowmonitor create-scope \
--targets '[{"targetIdentifier": {"targetId": {"accountId": "123456789012"}, "targetType": "ACCOUNT"}, "region": "us-east-1"}]' \
--region us-east-1
1.3 Create Monitor
Using the scope ARN returned in the previous command, create a monitor:
aws networkflowmonitor create-monitor \
--monitor-name "CWT-Load-Tester" \
--local-resources '[{"type": "AWS::VPC::VPC", "identifier": "arn:aws:ec2:us-east-1:123456789012:vpc/vpc-0b69ce8d04278ddd1"}]' \
--scope-arn "arn:aws:networkflowmonitor:us-east-1:123456789012:scope/your-scope-id" \
--region us-east-1
1.4 Submit Query: Retrieve Inter-AZ Traffic in the last hour
After generating cross-AZ traffic, the monitor can be interrogated using the StartQueryMonitorTopContributors API.
Similar to CloudWatch Log Insights, the behavior is:
- Submit a query with StartQueryMonitorTopContributors API
- Retrieve the results with GetQueryResultsMonitorTopContributors
% aws networkflowmonitor start-query-monitor-top-contributors \
--monitor-name CWT-Load-Tester \
--start-time "$(date -u -v-1H '+%Y-%m-%dT%H:%M:%SZ')" \
--end-time "$(date -u '+%Y-%m-%dT%H:%M:%SZ')" \
--metric-name DATA_TRANSFERRED \
--destination-category INTER_AZ
{
    "queryId": "9881b95c-d595-3b63-aa0a-d673f105b7f6"
}
1.5 Retrieve Query Results
To allow for easier analysis, the output was redirected to file flow-monitor-results.txt:
aws networkflowmonitor get-query-results-monitor-top-contributors \
--monitor-name CWT-Load-Tester \
--query-id "9881b95c-d595-3b63-aa0a-d673f105b7f6" > flow-monitor-results.txt
1.6 Review Output
Below is a snippet of the first entry of Network Flow Monitor top contributors for inter-AZ traffic flow-monitor-results.txt.
Below is the first contributor:
{
    "topContributors": [
        {
            "localIp": "172.31.11.9",
            "localInstanceId": "i-0a37bd5d822f52955",
            "localVpcId": "vpc-0b69ce8d04278ddd1",
            "localRegion": "us-east-1",
            "localAz": "use1-az2",              <<<<---------
            "localSubnetId": "subnet-07bf9f9ff03be1931",
            "targetPort": 0,
            "remoteVpcId": "vpc-0b69ce8d04278ddd1",
            "remoteRegion": "us-east-1",
            "remoteAz": "use1-az1",              <<<<---------
            "remoteSubnetId": "subnet-002bdfe1767d0ddb0",
            "remoteInstanceId": "",
            "remoteIp": "172.31.0.156",
            "value": 2529792,
            "traversedConstructs": [
                {
                    "componentId": "i-0a37bd5d822f52955",
                    "componentType": "AWS::EC2::Instance",
                    "componentArn": "arn:aws:ec2:us-east-1:000000000000:instance/i-0a37bd5d822f52955"
                },
                {
                    "componentId": "eni-0e5cac6f8704f764e",
                    "componentType": "AWS::EC2::NetworkInterface",
                    "componentArn": "arn:aws:ec2:us-east-1:123456789012:network-interface/eni-0e5cac6f8704f764e"
                },
                {
                    "componentId": "eni-013a3ffbb2314b268",
                    "componentType": "AWS::EC2::NetworkInterface",
                    "componentArn": "arn:aws:ec2:us-east-1:123456789012:network-interface/eni-013a3ffbb2314b268"
                }
            ],
            "localInstanceArn": "arn:aws:ec2:us-east-1:123456789012:instance/i-0a37bd5d822f52955",
            "localSubnetArn": "arn:aws:ec2:us-east-1:123456789012:subnet/subnet-07bf9f9ff03be1931",
            "localVpcArn": "arn:aws:ec2:us-east-1:123456789012:vpc/vpc-0b69ce8d04278ddd1",
            "remoteInstanceArn": "",
            "remoteSubnetArn": "arn:aws:ec2:us-east-1:123456789012:subnet/subnet-002bdfe1767d0ddb0",
            "remoteVpcArn": "arn:aws:ec2:us-east-1:123456789012:vpc/vpc-0b69ce8d04278ddd1"
        },
Taking a look at the localAz and remoteAz values, this flow was definitely between availability zones. There are also other valuable fields such as localIp, localInstanceId and localVpcId. In particular, traversedConstructs captures the path from EC2 instance i-0a37bd5d822f52955 to its ENI and the destination ENI.
Unfortunately, Network Flow Monitor does not report on the type of traffic (e.g. protocol, port, etc) that was exchanged between the endpoints.
2. Custom VPC Flow Logs ▾
Custom VPC Flow Logs does not capture enough information to directly filter for cross AZ traffic. Although the custom VPC Flow Log format does report AZ information, only the AZ associated with the ENI the logs are generated for is logged. Therefore, only 1 out of 2 AZ's is reporting in each log event.
In the past, other solutions to filter for cross AZ traffic have used:
- DescribeNetworkInterfaces to look up private IP addresses to discover the corresponding AZ
- Then enrich VPC Flow Logs with this information
VPC Flow Logs can be used to provide more context (e.g. protocol, port, etc) on the data transfers returned by Network Flow Monitor.
2.1 Analyzing Flow Logs with CloudWatch Log Insights
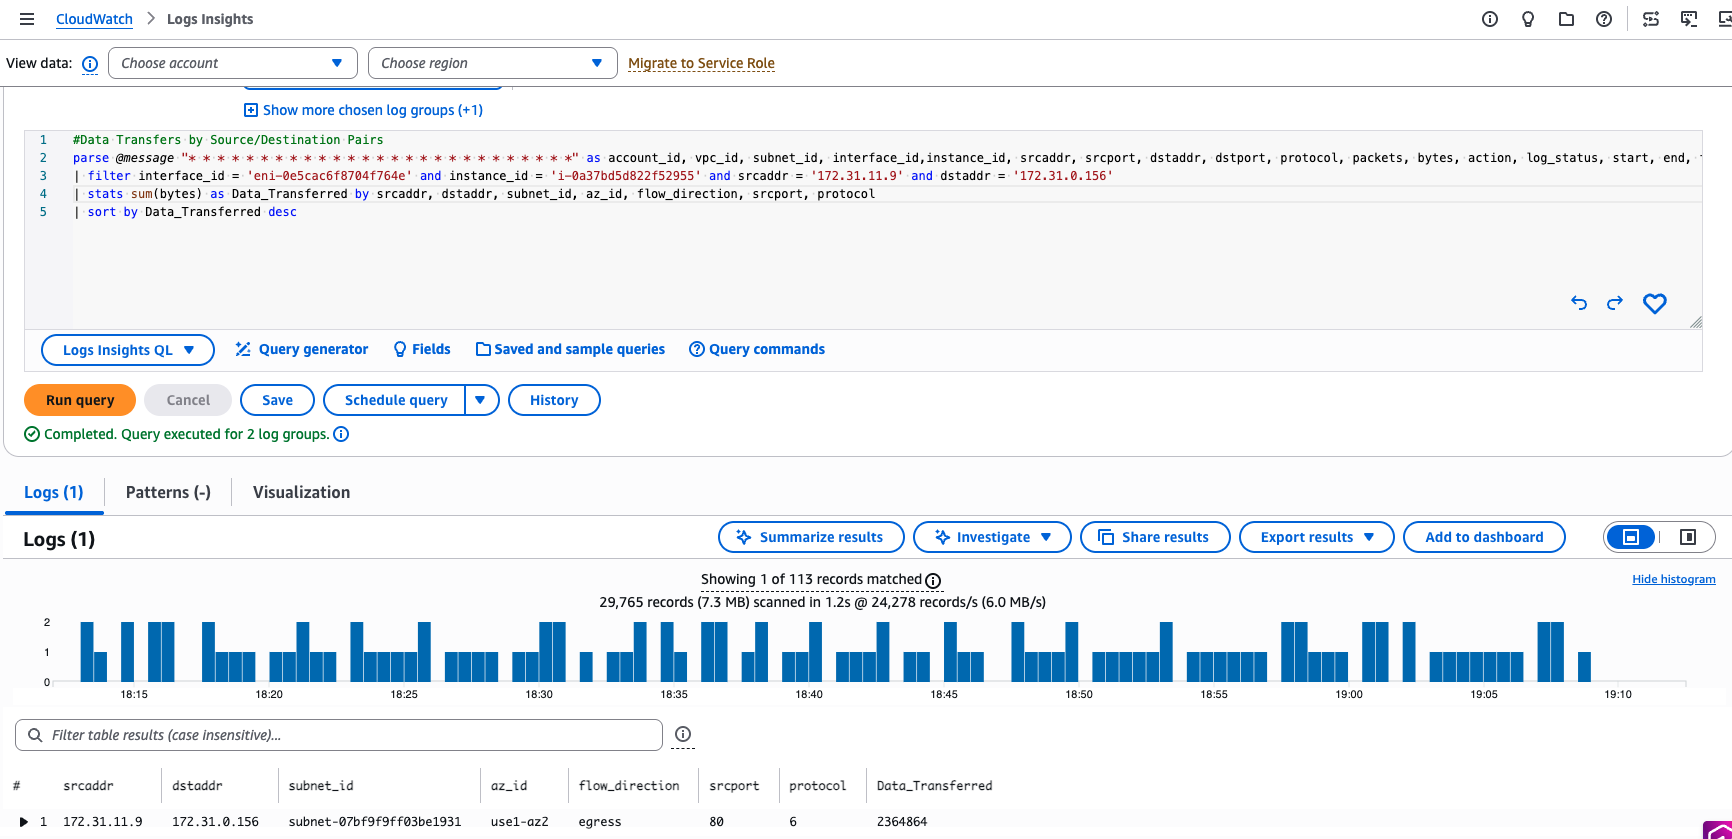
Using the details (e.g. interface_id, instance_id, srcaddr and dstaddr) in the Network Flow Monitor contributor output, a CloudWatch Log Insights query was written to aggregate VPC Flow Logs during the same timeframe.
#Data Transfers by Source/Destination Pairs
parse @message "* * * * * * * * * * * * * * * * * * * * * * * * * * *" as account_id, vpc_id, subnet_id, interface_id,instance_id, srcaddr, srcport, dstaddr, dstport, protocol, packets, bytes, action, log_status, start, end, flow_direction, traffic_path, tcp_flags, pkt_srcaddr, pkt_src_aws_service, pkt_dstaddr, pkt_dst_aws_service, region, az_id, sublocation_type, sublocation_id
| filter interface_id = 'eni-0e5cac6f8704f764e' and instance_id = 'i-0a37bd5d822f52955' and srcaddr = '172.31.11.9' and dstaddr = '172.31.0.156'
| stats sum(bytes) as Data_Transferred by srcaddr, dstaddr, subnet_id, az_id, flow_direction, srcport, protocol
| sort by Data_Transferred desc| srcaddr | dstaddr | subnet_id | az_id | flow_direction | srcport | protocol | Data_Transferred |
|---|---|---|---|---|---|---|---|
| 172.31.11.9 | 172.31.0.156 | subnet-07bf9f9ff03be1931 | use1-az2 | egress | 80 | 6 | 2364864 |
The query results indicate that 2.25MB of web traffic was exchanged between EC2 instance i-0a37bd5d822f52955 (172.31.11.9) and eni-0e5cac6f8704f764e. DescribeNetworkInterfaces can also be used programmatically to retrieve ENI descriptions (e.g. associated with Lambda, ALB, VPC Endpoints, etc). It was found that eni-0e5cac6f8704f764e is associated with an Application Load Balancer (ALB) which fronts web server i-0a37bd5d822f52955.
Consequently, the cross-AZ traffic is consistent with ALB's default behavior of cross-zone load balancing being enabled.