CloudWatch Log Analytics
Analyze VPC Flow Logs with Log Analytics
1. Overview ▾
- Custom VPC Flow logs could be enabled on NLB ENI's for more visibility.
- To identify targets emitted TCP RST's include the
tcp-flagsfield. - In situations where the original source and destination IP addresses are obscured or translated, consider including
pkt-srcaddrorpkt-dstaddrfields. - To allow for easier analysis, VPC Flow Logs should be configured with the same custom VPC Flow Log format across VPCs and accounts.
- To identify targets emitted TCP RST's include the
Custom Log Format:
TEXT
${account-id} ${vpc-id} ${subnet-id} ${interface-id} ${instance-id} ${srcaddr} ${srcport} ${dstaddr} ${dstport} ${protocol} ${packets} ${bytes} ${action} ${log-status} ${start} ${end} ${flow-direction} ${traffic-path} ${tcp-flags} ${pkt-srcaddr} ${pkt-src-aws-service} ${pkt-dstaddr} ${pkt-dst-aws-service} ${region} ${az-id} ${sublocation-type} ${sublocation-id}2. Querying VPC Flow Logs ▾
Log Analytics offers more flexibility in query structure (e.g. filters, aggregations and visualizations) and can produce more granular results.
Here is a re:Post article and video that provides four (4) CloudWatch Logs Insights queries to analyze VPC Flow Logs:
- Aggregating REJECT flows for specific subnets and host IP addresses
- Filtering on REJECT flows for a specific ENI
- Aggregating HTTP/HTTPS or SMTP traffic on a given ENI by source IP address, destination IP and destination port
- Filtering traffic on a given source IP address or subnet
The article provides queries based on the default VPC Flow Log format. When using custom VPC Flow Logs format, the user can arbitrary order the sequence of fields. parse allows CloudWatch Logs Insights to correctly analyze all custom fields.
3. Sample Queries ▾
Here are additional queries you can extend and customize to your use cases.
3.1 Filter Inbound Traffic with RST flags on NLB ENI's
SQL
parse @message "* * * * * * * * * * * * * * * * * * * * * * * * * * *" as account_id, vpc_id, subnet_id, interface_id,instance_id, srcaddr, srcport, dstaddr, dstport, protocol, packets, bytes, action, log_status, start, end, flow_direction, traffic_path, tcp_flags, pkt_srcaddr, pkt_src_aws_service, pkt_dstaddr, pkt_dst_aws_service, region, az_id, sublocation_type, sublocation_id
| filter interface_id in ["eni-0cadc266d476ae847","eni-05c54c575a830536c"] and tcp_flags = 4 and flowDirection = "ingress"
| display @timestamp, interface_id, srcaddr, srcport,dstaddr, dstport, action, tcp_flags, flow_direction
| sort @timestamp desc
| limit 4| @timestamp | interface_id | srcaddr | srcport | dstaddr | dstport | action | tcp_flags | flow_direction |
|---|---|---|---|---|---|---|---|---|
| 2026-07-19 23:59:43.000 | eni-0cadc266d476ae847 | 10.0.4.98 | 80 | 10.0.1.217 | 19358 | ACCEPT | 4 | ingress |
| 2026-07-19 23:59:43.000 | eni-0cadc266d476ae847 | 10.0.4.98 | 80 | 10.0.1.217 | 56381 | ACCEPT | 4 | ingress |
| 2026-07-19 23:59:39.000 | eni-0cadc266d476ae847 | 10.0.4.192 | 80 | 10.0.1.217 | 63312 | ACCEPT | 4 | ingress |
| 2026-07-19 23:59:33.000 | eni-0cadc266d476ae847 | 10.0.3.96 | 80 | 10.0.1.217 | 22824 | ACCEPT | 4 | ingress |
3.2 Top Source IP's attempting SSH (REJECT Traffic)
SQL
parse @message "* * * * * * * * * * * * * * * * * * * * * * * * * * *" as account_id, vpc_id, subnet_id, interface_id,instance_id, srcaddr, srcport, dstaddr, dstport, protocol, packets, bytes, action, log_status, start, end, flow_direction, traffic_path, tcp_flags, pkt_srcaddr, pkt_src_aws_service, pkt_dstaddr, pkt_dst_aws_service, region, az_id, sublocation_type, sublocation_id
| filter action = "REJECT" and protocol = 6 and dstport = 22
| stats sum(bytes) as SSH_Traffic_Volume by srcaddr
| sort by SSH_Traffic_Volume desc
| limit 5| srcaddr | SSH_Traffic_Volume |
|---|---|
| 45.148.10.230 | 560 |
| 18.118.100.31 | 420 |
| 180.167.128.203 | 352 |
| 195.178.110.137 | 312 |
| 103.217.186.62 | 240 |
3.3 Top EC2 Instance ID's by Data Transfers
SQL
parse @message "* * * * * * * * * * * * * * * * * * * * * * * * * * *" as account_id, vpc_id, subnet_id, interface_id,instance_id, srcaddr, srcport, dstaddr, dstport, protocol, packets, bytes, action, log_status, start, end, flow_direction, traffic_path, tcp_flags, pkt_srcaddr, pkt_src_aws_service, pkt_dstaddr, pkt_dst_aws_service, region, az_id, sublocation_type, sublocation_id
| stats sum(bytes) as Data_Transferred by instance_id
| sort by Data_Transferred desc
| limit 5| instance_id | Data_Transferred |
|---|---|
| - | 18230378688450 |
| i-0075e2fb3e534ba67 | 2579356769762 |
| i-0822bd396bfcc697c | 2572381315537 |
| i-0fbcb2b36e9b60397 | 2518258902455 |
| i-0528f2fbfb68005cd | 2475195967477 |
3.4 Timeseries: HTTP Data Stream for Cluster hosted in 2 subnets
SQL
filter dstPort = 80 and (isIpInSubnet(dstAddr, "10.0.4.0/24") or isIpInSubnet(dstAddr, "10.0.3.0/24"))
| stats sum(bytes) as Data_Transferred by bin(1m)| bin(1m) | Data_Transferred |
|---|---|
| 2026-07-20 01:54:00.000 | 887 |
| 2026-07-20 01:53:00.000 | 48783 |
| 2026-07-20 01:52:00.000 | 96886 |
| 2026-07-20 01:51:00.000 | 93636 |
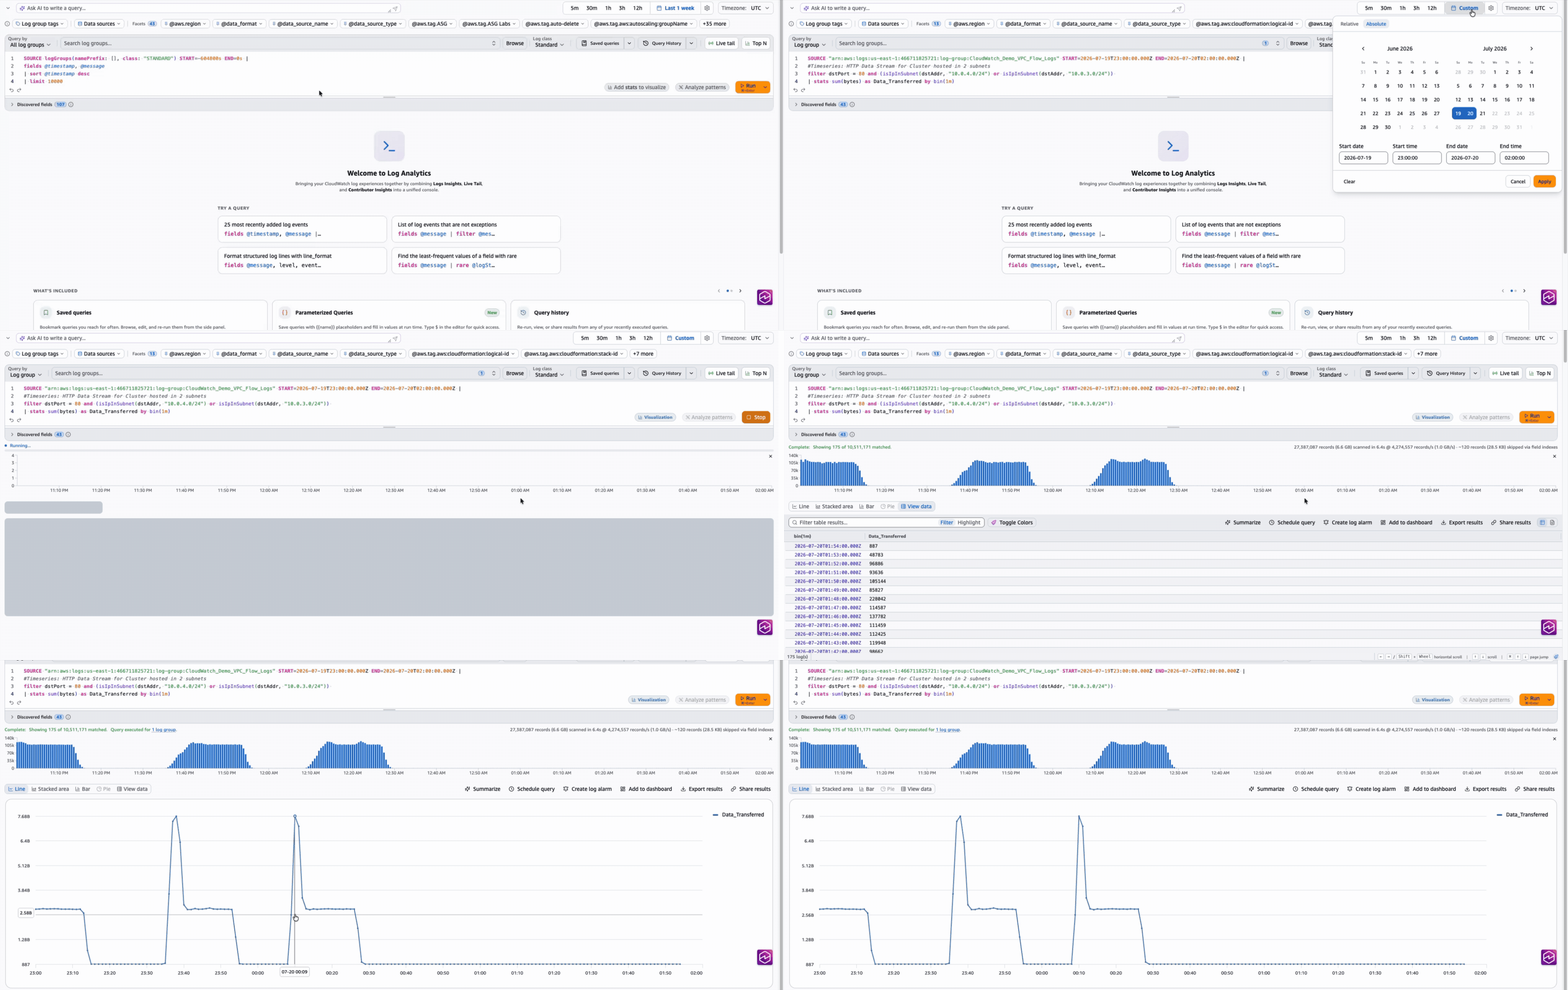
Fig 2: Isolating a HTTP Data Stream