Monitoring EC2 Applications
1. Metric Insights Alarms ▾
EC2 workloads can have numerous resources (e.g. 1000+ instances). This can present challenges when:
- monitoring large clusters
- monitoring a subset of instances which may not be part of an Autoscaling Group
- managing alarms for Autoscaling Group with frequent scaling actions
CloudWatch Alarms based on Metric Insights will automatically update the resources being monitored by the alarm as resources change. This reduces the administrative effort to ensure CloudWatch Alarms are monitoring active resources.
Here are references for creating alarms for AWS Services:
2. Sample Metric Insights Queries ▸
The following queries can be applied to either CloudWatch alarms or dashboards.
2.1 Aggregate StatusCheckFailed_Instance
- Returns a single time-series of
AWS/EC2native metric. - Will alert on ANY instance in the ASG breaching the threshold.
- Additional steps will be required to identify the specific instance impacted.
- Dimensions
AutoScalingGroupNameandInstanceIdare not published together. Consequently, it is not possible to obtain individual instances metric data with this query.
SELECT MAX(StatusCheckFailed_Instance)
FROM SCHEMA("AWS/EC2", AutoScalingGroupName)
WHERE AutoScalingGroupName = 'My-ASG-Name'
ORDER BY MAX() DESC
2.2 Top 10 Instances in an Autoscaling Group (Single Tag)
- Returns a
StatusCheckFailed_Instancetime-series for each instance in the ASG. - By leveraging tags (e.g.
Stage:PROD,App_Severity:Tier1) rather than dimensions, Metric Insights queries can isolate:- aggregate metric data for an Autoscaling Group
- OR instance-level metrics for EC2 instances sharing a specific tag.
- Alarm notifications explicitly identify instance(s) breaching the threshold. In this way, remediation steps can be taken immediately.
SELECT MAX(StatusCheckFailed_Instance)
FROM SCHEMA("AWS/EC2", InstanceId)
WHERE tag."aws:autoscaling:groupName" = 'My-ASG-Name'
GROUP BY InstanceId
ORDER BY MAX() DESC
LIMIT 10
3. Alarms based on CloudWatch Agent Metrics ▾
- If the EC2 instances are using the CloudWatch Agent to publish OS and application metrics, corresponding queries can be written.
- Below returns the
Memory % Committed Bytes In Usefor all instances in the Autoscaling group.
3.1 CPU Utilization > 80%
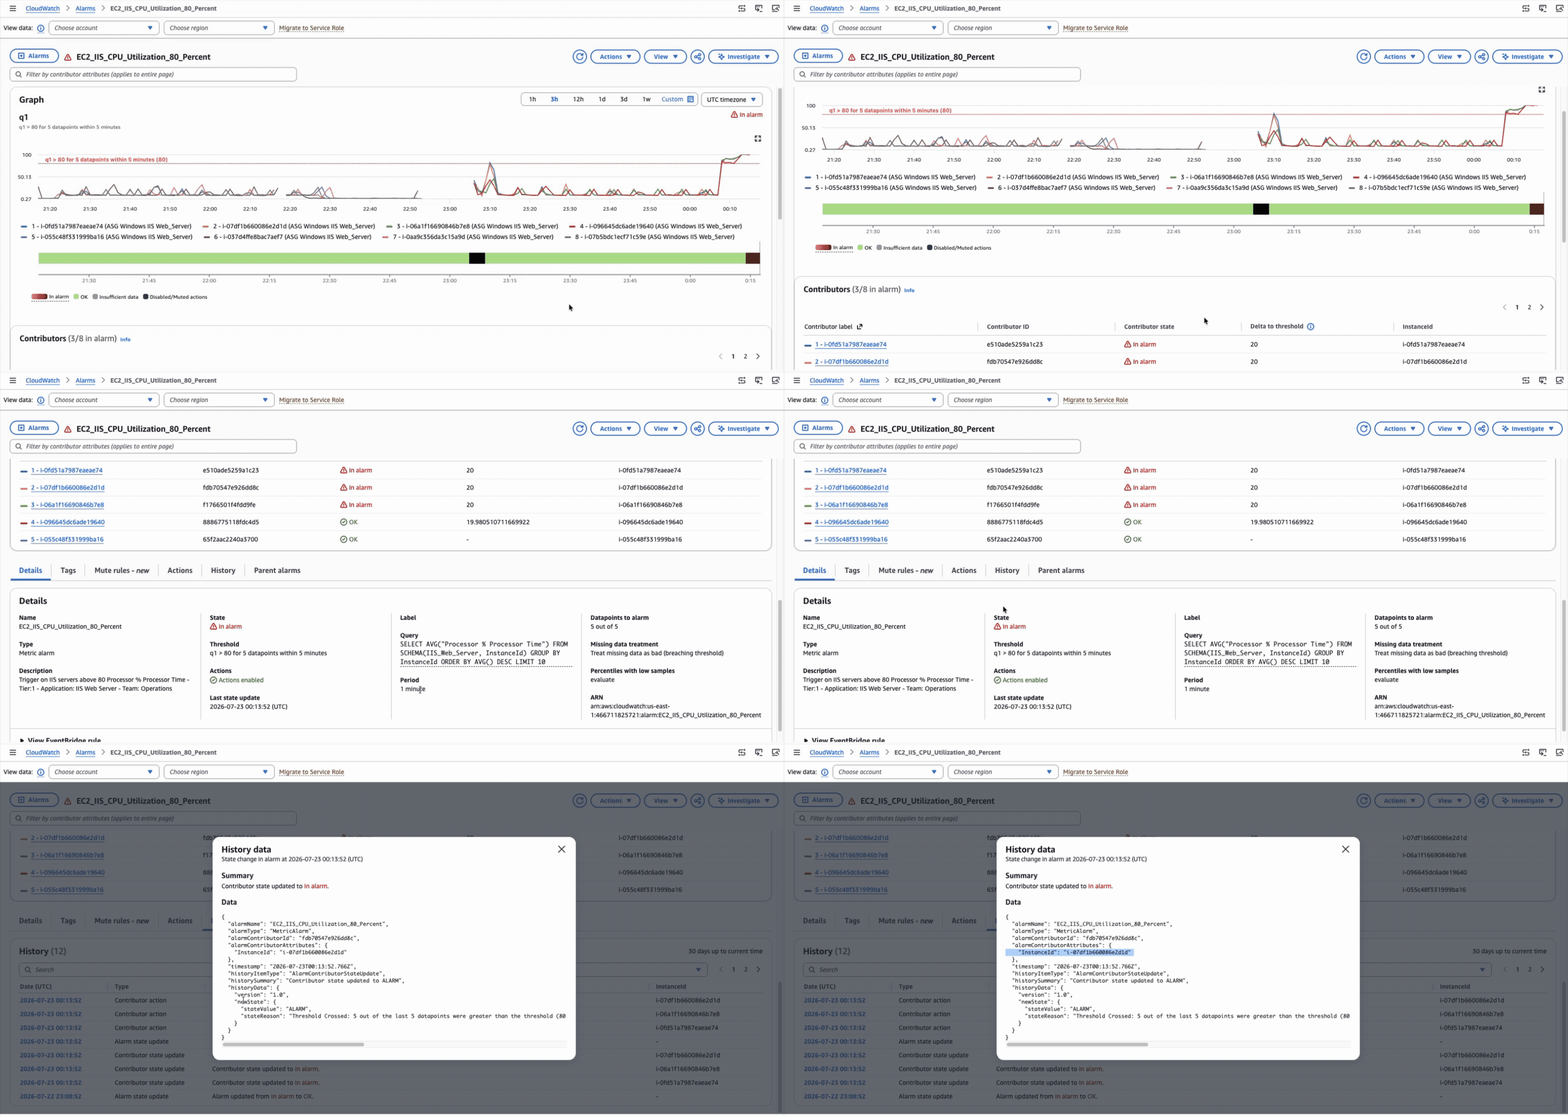
SELECT AVG("Processor % Processor Time")
FROM SCHEMA(IIS_Web_Server, InstanceId)
GROUP BY InstanceId
ORDER BY AVG() DESC
LIMIT 10
3.2 Memory Utilization > 80%
SELECT AVG("Memory % Committed Bytes In Use")
FROM SCHEMA(IIS_Web_Server, AutoScalingGroupName,ImageId,InstanceId,InstanceType,objectname)
GROUP BY InstanceId
ORDER BY AVG() DESC
LIMIT 10
3.3 Disk Utilization < 5GB
- Monitoring disk utilization on a specific disk
SELECT AVG("LogicalDisk Free Megabytes")
FROM SCHEMA(IIS_Web_Server, AutoScalingGroupName,ImageId,InstanceId,InstanceType,instance,objectname)
WHERE instance = 'C:'
GROUP BY InstanceId
ORDER BY AVG() DESC
LIMIT 10
3.4 IIS Process DOWN
SELECT MIN("procstat_lookup pid_count")
FROM SCHEMA(IIS_Web_Server, AutoScalingGroupName, ImageId, InstanceId, InstanceType, exe, pid_finder)
WHERE exe = 'w3wp'
GROUP BY InstanceId
ORDER BY MIN() ASC
LIMIT 10
4. Alarm Notification ▸
The Alarm Notification explicitly identifies the contributor (e.g. EC2 instance ID) breaching the threshold. In this way, operation teams can focus on the specific instance and remediating the problem.
You are receiving this email because your Amazon CloudWatch Alarm "IIS_Disk_Utilization_C_Drive_5GB_POC" contributor "0c8774769375e407" in the US East (N. Virginia) region has entered the ALARM state, because "Threshold Crossed: 5 out of the last 5 datapoints were less than the threshold (5000.0). The most recent datapoint which crossed the threshold: [4944.0 (18/07/26 16:49:00)] (minimum 5 datapoints for OK -> ALARM transition)." at "Saturday 18 July, 2026 16:51:00 UTC".

View this alarm in the AWS Management Console:
https://us-east-1.console.aws.amazon.com/cloudwatch/home?region=us-east-1#alarmsV2:alarm/IIS_Disk_Utilization_C_Drive_5GB_POC

Alarm Details:
- Name:                       IIS_Disk_Utilization_C_Drive_5GB_POC
- Description:                Trigger on IIS servers below 5GB Free Disk Space on C:
- Tier:1
- Application: Foo
- Team: Operations
- [Runbook: Troubleshoot High Memory Utilization](https://example.com)
- AWS Account:                123456789012
- Alarm Arn:                  arn:aws:cloudwatch:us-east-1:123456789012:alarm:IIS_Disk_Utilization_C_Drive_5GB_POC

Contributor Details:
- Id:                         0c8774769375e407
- State Change:               OK -> ALARM
- Reason for State Change:    Threshold Crossed: 5 out of the last 5 datapoints were less than the threshold (5000.0). The most recent datapoint which crossed the threshold: [4944.0 (18/07/26 16:49:00)] (minimum 5 datapoints for OK -> ALARM transition).
- Timestamp:                  Saturday 18 July, 2026 16:51:00 UTC

Contributor Attributes:
- InstanceId                i-017c46b9548c421cf

Threshold:
- The alarm is in the ALARM state when the metric is LessThanThreshold 5000.0 for at least 5 of the last 5 period(s) of 60 seconds.

Monitored Metrics:
- MetricExpression:           SELECT AVG("LogicalDisk Free Megabytes") FROM SCHEMA(IIS_Web_Server, AutoScalingGroupName,ImageId,InstanceId,InstanceType,instance,objectname) WHERE instance = 'C:' GROUP BY InstanceId ORDER BY AVG() DESC LIMIT 10
- MetricLabel:                No Label

State Change Actions:
- OK:
- ALARM: [arn:aws:sns:us-east-1:123456789012:CWT-SNS-Notification]
- INSUFFICIENT_DATA:
5. Composite & Metric Alarms ▾
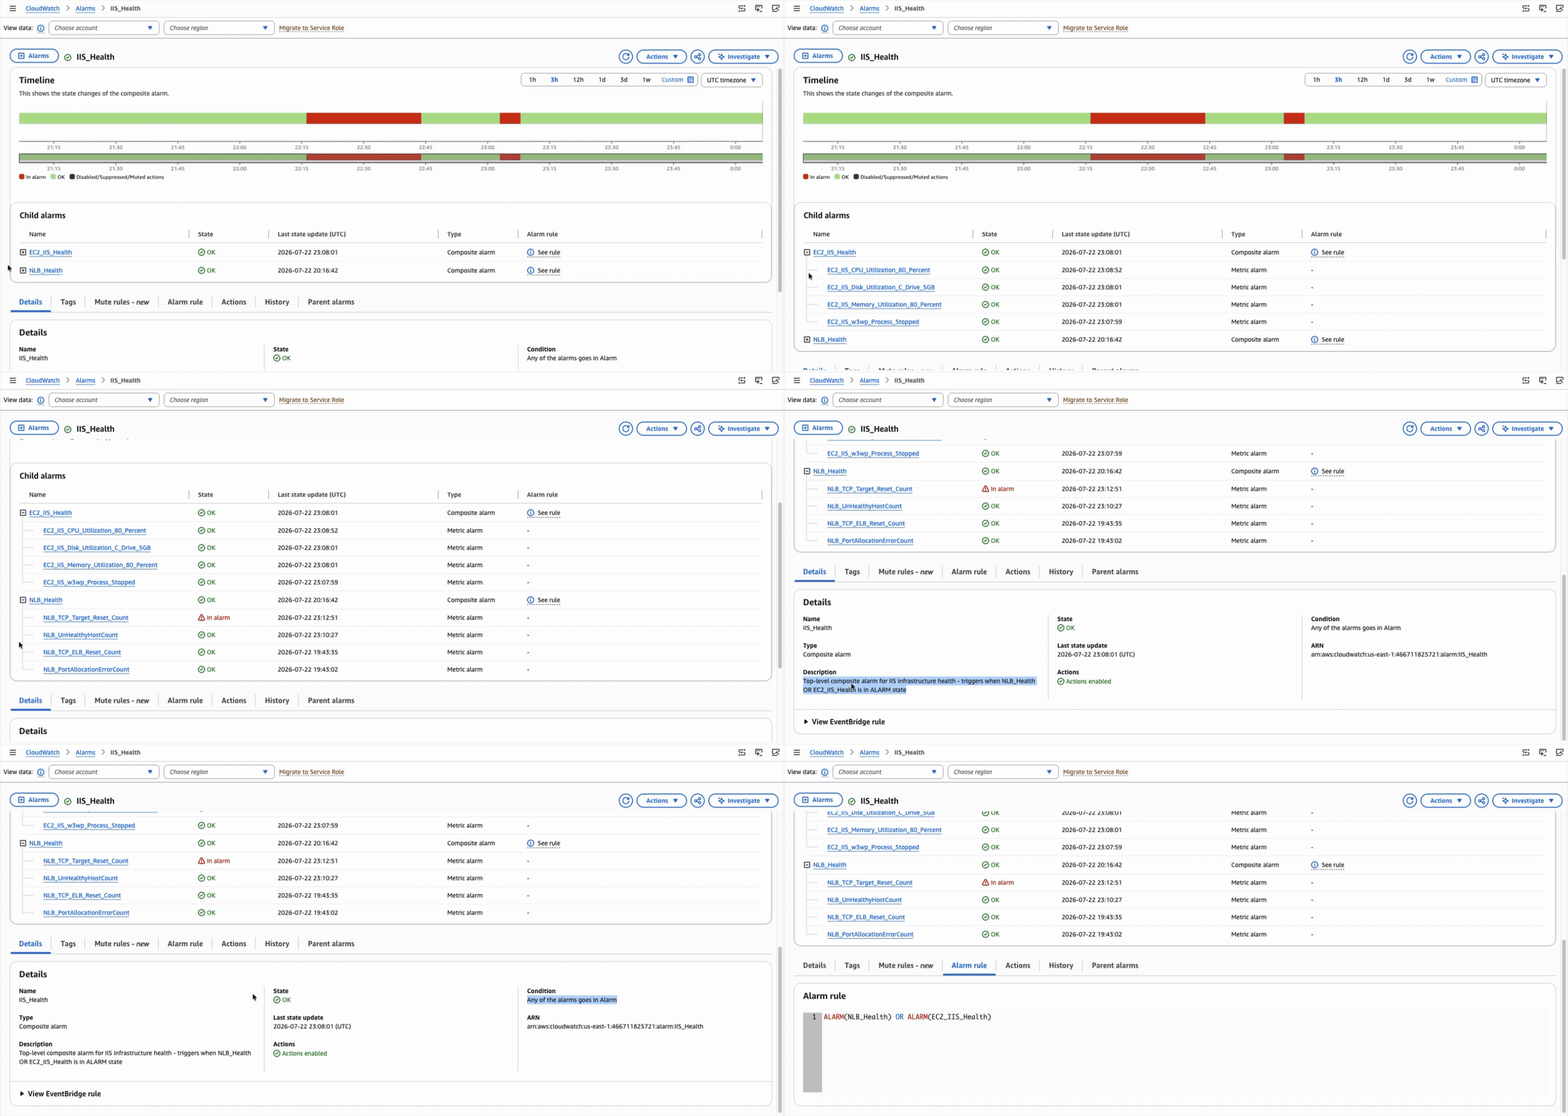
A deployment may include both Composite and Metric Alarms.
In this way, the DevOps Team has the flexibility to determine:
- which alarms to notification on
- which combination of alarms warrant a page
The figure below includes alarms for EC2 web application as well as the load balancer fronting it.