How do I monitor EC2 instances in an Autoscaling Group?
I have several workloads deployed with Autoscaling Groups. I'll like to create CloudWatch alarms and dashboards to monitor the individual EC2 instances. How can this be implemented considering instances are launched and terminated over time?
Short Description ▾
CloudWatch Metric Insights used queries to retrieve performance metrics. The queries match metric data for the target resource. Even, the underlying resources change over time.
EC2 workloads can have numerous resources (e.g. 100+ instances). This can present challenges when:
- monitoring large clusters
- monitoring a subset of instances which may not be part of an Autoscaling Group
- managing alarms for Autoscaling Group with frequent scaling actions
By leveraging tags (e.g. Stage:PROD, App_Severity:Tier1) rather than dimensions, Metric Insights can isolate metric data for an Autoscaling Group or a group of EC2 instances sharing that tag.
Metric Insights Alarms ▾
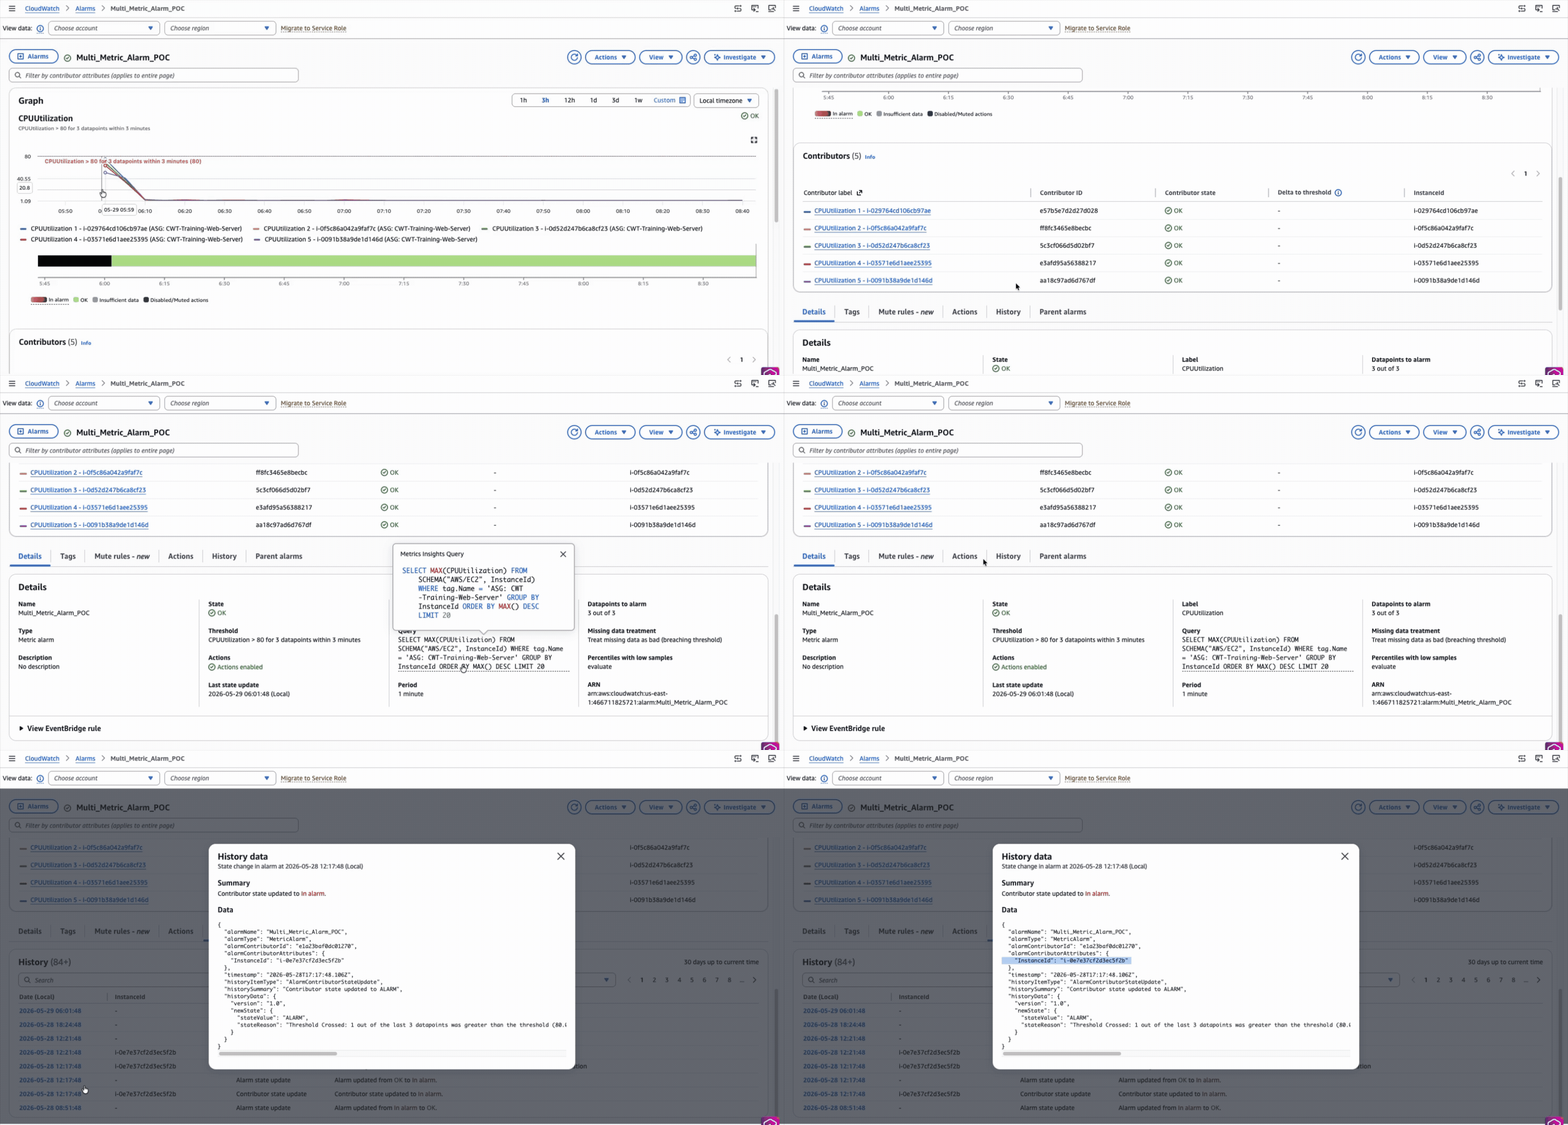
In the past, custom solutions were deployed to maintain alarms as scaling actions changed resources. For example, EventBridge rules with Lambda targets were created to dynamically create alarms when new resources were launched and terminate alarms when scale in occurred.
CloudWatch Alarms based on Metric Insights will automatically update the resources being monitored by the alarm as resources change. This reduces the administrative effort to ensure CloudWatch Alarms are monitoring active resources.
Alarm Notification ▾
The Alarm Notification explicitly identifies the contributor (e.g. EC2 instance ID) breaching the threshold. In this way, operation teams can focus on the specific instance and remediating the problem.
You are receiving this email because your Amazon CloudWatch Alarm "Multi_Metric_Alarm_POC3" contributor "3d33eb2418294311" in the US East (N. Virginia) region has entered the ALARM state, because "Threshold Crossed: 1 out of the last 3 datapoints was greater than the threshold (80.0) and 2 missing datapoints were treated as [Breaching]. The most recent datapoint which crossed the threshold: [92.45600306355205 (28/05/26 17:49:00)] (minimum 3 datapoints for OK -> ALARM transition)." at "Thursday 28 May, 2026 17:54:49 UTC".

View this alarm in the AWS Management Console:
https://us-east-1.console.aws.amazon.com/cloudwatch/home?region=us-east-1#alarmsV2:alarm/Multi_Metric_Alarm_POC3

Alarm Details:
- Name:                       Multi_Metric_Alarm_POC
- Description:
- AWS Account:                123456789012
- Alarm Arn:                  arn:aws:cloudwatch:us-east-1:123456789012:alarm:Multi_Metric_Alarm_POC3

Contributor Details:
- Id:                         3d33eb2418294311
- State Change:               OK -> ALARM
- Reason for State Change:    Threshold Crossed: 1 out of the last 3 datapoints was greater than the threshold (80.0) and 2 missing datapoints were treated as [Breaching]. The most recent datapoint which crossed the threshold: [92.45600306355205 (28/05/26 17:49:00)] (minimum 3 datapoints for OK -> ALARM transition).
- Timestamp:                  Thursday 28 May, 2026 17:54:49 UTC

Contributor Attributes:
- InstanceId                i-0232857807237393a

Threshold:
- The alarm is in the ALARM state when the metric is GreaterThanThreshold 80.0 for at least 3 of the last 3 period(s) of 300 seconds.

Monitored Metrics:
- MetricExpression:           SELECT MAX(CPUUtilization) FROM SCHEMA("AWS/EC2", InstanceId) WHERE tag."Web Server" = 'NGiNX' AND tag.OS = 'Amazon Linux 2' GROUP BY InstanceId ORDER BY AVG() DESC LIMIT 20
- MetricLabel:                CPUUtilization

State Change Actions:
- OK:
- ALARM: [arn:aws:sns:us-east-1:123456789012:CWT-SNS-Notification]
- INSUFFICIENT_DATA:
Sample Metric Insights Queries ▾
The following queries can be applied to either CloudWatch alarms or dashboards.
1. Aggregate StatusCheckFailed_Instance
- Returns a single time-series of
AWS/EC2native metric. - An alarm based on this query will alert on any instance in the Autoscaling that experiences a failed status check.
- Further steps will be necessary to identify the specific instance breaching the threshold.
- Dimensions
AutoScalingGroupNameandInstanceIdare not published together. Consequently, it is not possible to obtain individual instances metrics for a given AutoScaling Group.
SELECT MAX(StatusCheckFailed_Instance)
FROM SCHEMA("AWS/EC2", AutoScalingGroupName)
WHERE AutoScalingGroupName = 'My-ASG-Name'
ORDER BY MAX() DESC
2. Top 10 Instances in an Autoscaling Group (Single Tag)
- Returns a
AWS/EC2nativeStatusCheckFailed_Instancemetric data for each instance in the group. - Leverages tags rather than dimensions to isolate metric data.
- When used with an alarm, the notification will identify the instance(s) breaching the threshold. In this way, remediation steps can be taken immediately.
SELECT MAX(StatusCheckFailed_Instance)
FROM SCHEMA("AWS/EC2", InstanceId)
WHERE tag."aws:autoscaling:groupName" = 'My-ASG-Name'
GROUP BY InstanceId
ORDER BY MAX() DESC
LIMIT 10
3. Top 10 Instances in an Autoscaling Group (Multiple Tags)
- By using multiple tags, a specific set of EC2 instances can be monitored
- When used for an Autoscaling Group, please ensure the selected tags are unique to that group.
SELECT MAX(StatusCheckFailed_Instance)
FROM SCHEMA("AWS/EC2", InstanceId) WHERE tag.OS = 'Amazon Linux 2' AND tag."Web Server" = 'NGiNX'
GROUP BY InstanceId
ORDER BY MAX() DESC
LIMIT 10
4. Top 10 instances using custom metrics published by CloudWatch Agent
- If the EC2 instances are using the CloudWatch Agent to publish OS and application metrics, corresponding queries can be written.
- Below returns the
cpu_usage_systemfor all instances in the Autoscaling group.
SELECT AVG(cpu_usage_system)
FROM SCHEMA("PROD-Web-Service", AutoScalingGroupName,CPU,InstanceId,cpu)
GROUP BY InstanceId
ORDER BY AVG() DESC
LIMIT 10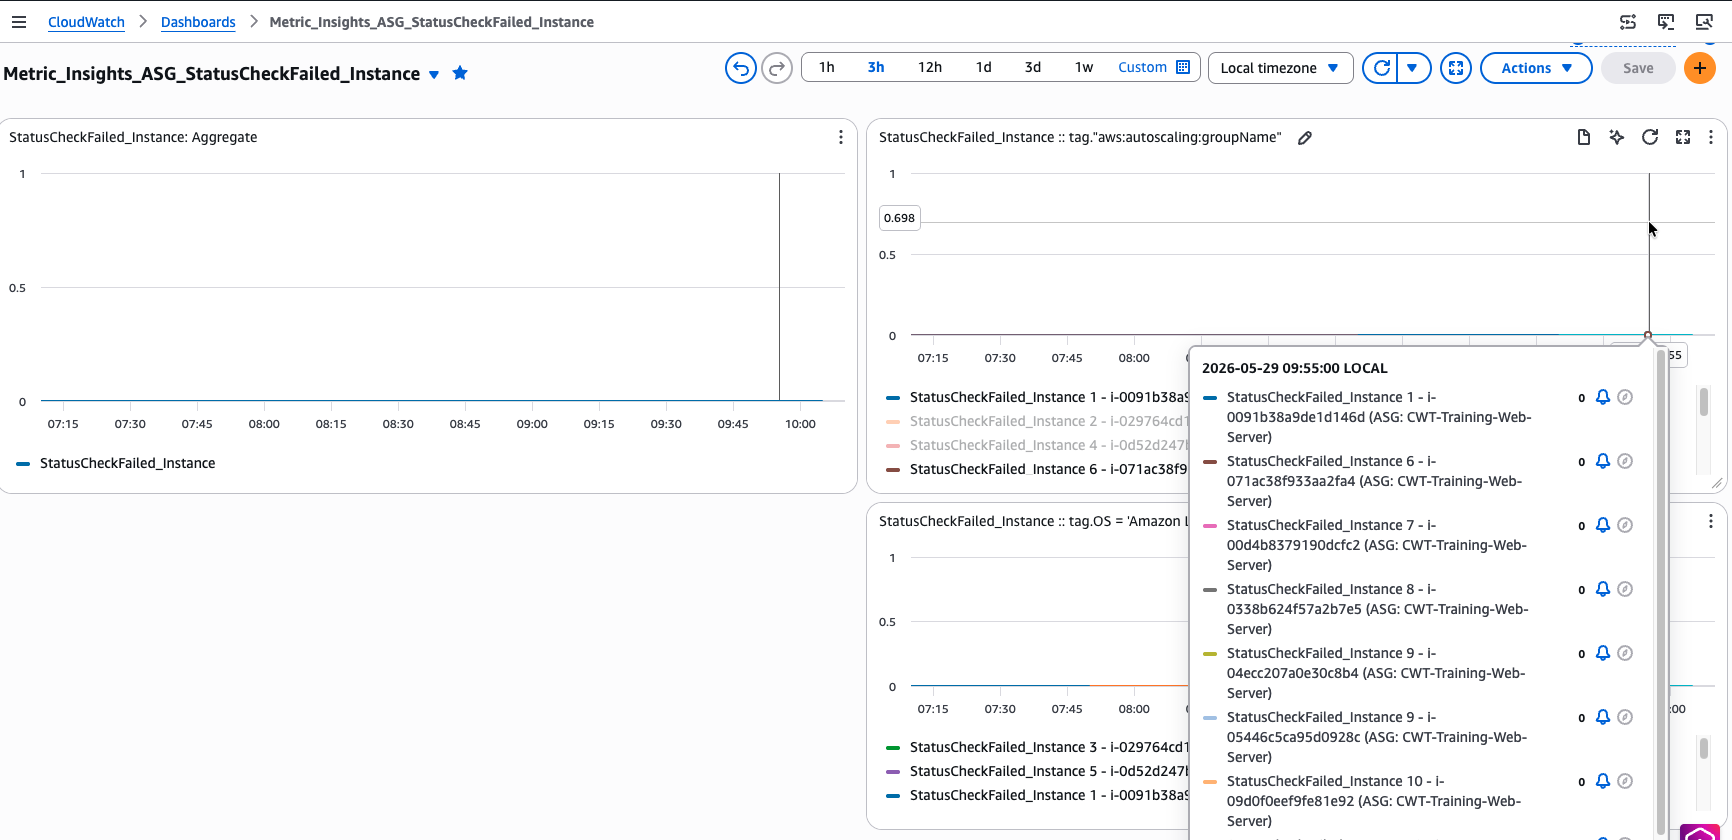
Artifacts ▾
Here are CloudFormation templates to assist with deploying CloudWatch Alarms and Dashboards based on Metric Insights queries.
These can be used for reference and expanded on to align with your use case. Please follow this guide to deploy the template using the CloudFormation console.